After the 2013 flood in Alberta, the riparian area increased its importance because of the protection against flood damages. Then, a comprehensive survey based on FREP protocol about the health of riparian area began in 2015 and this data was used in this work to evidence what causes are related to an unhealthy riparian area and what is the contribution of conventional treatments.
Forest and Range Evaluation Program (FREP)
The data collection was based on the 'FREP Protocol for Evaluating the Condition of Streams and Riparian Management Areas (Riparian Management Routine Effectiveness Evaluation)'. The method was conceived by the Government of British Columbia to determine whether Forest and Range Practices Act (FRPA) standards and practices governed by regulation are achieving the desired result of protecting fish values by maintaining channel and riparian functions.
Summarizing its use in one question: “Are riparian forestry and range practices effective in maintaining the structural integrity and functions of stream ecosystems and other aquatic resource features over both short and long terms?”
The survey is accomplished via a complex questionnaire resulting in a table with more than 200 variables. The dataset used for this work contained information from 277 sites visited in 2015, 2016 and 2017.
Table 01: Fifteen main questions used to assess the relative health, or “functioning condition” of a stream and its riparian habitat.
Question Number |
Question |
Question 1 |
Is the channel bed undisturbed? |
Question 2 |
Are the channel banks intact? |
Question 3 |
Are channel Large Woody Debris (LWD) processes intact? |
Question 4 |
Is the channel morphology intact? |
Question 5 |
Are all aspects of the aquatic habitat sufficiently connected to allow for normal, unimpeded movements of fish, organic debris, and sediments? |
Question 6 |
Does the stream support a good diversity of fish cover attributes? |
Question 7 |
Does the amount of moss present on the substrates indicate a stable and productive system? |
Question 8 |
Has the introduction of fine inorganic sediments been minimized? |
Question 9 |
Does the stream support a diversity of aquatic invertebrates? |
Question 10 |
Has the vegetation retained in the Riparian Management Area(RMA) been sufficiently protected from windthrow? |
Question 11 |
Has the amount of bare erodible ground or soil disturbance in the riparian area been minimized? |
Question 12 |
Has sufficient vegetation been retained to maintain an adequate root network or LWD supply? |
Question13 |
Has sufficient vegetation been retained to provide shade and reduce bank microclimate change? |
Question 14 |
Have the number of disturbance-increaser species, noxious weeds and/or invasive plant species present been limited to a satisfactory level? |
Question 15 |
Is the riparian vegetation within the first 10 m from the edge of the stream generally characteristic of what the healthy, unmanaged riparian plant community would normally be along the reach? |
The criteria is based on the quantities of "No" answers for the questions above:
0 to 2: Properly functioning
3 to 4: Properly functioning at risk
5 to 6: Properly functioning at high risk
7 and over: Not functioning properly
The answer to any question may not be immediately obvious or certain. To help experts and non-experts alike answer the questions, a number of “indicator” statements are provided for each question that also require a Yes or No answer. The indicator statements refer to specific attributes that can be more easily assessed or measured than the more general questions. An example with question 11 demonstrates the guidance in the table below. If any of the answers are No for 11.a, 11.b, 11.c or 11.d, then the answer to Question 11 is No. Question 11 does not allow for any No answers because of the sensitivity of streams to bare erodible or disturbed ground within or hydrologically linked to the riparian area.
Table 02: Example: Guidance to answer Question 11. If the answer for all the statements is Yes, mark the 'YES' box. Otherwise, 'No'. The guidance method varies in the other questions because each question has its own method.
Question 11 |
Has the amount of bare erodible ground or soil disturbance in the riparian area been minimized? |
11.a |
Total bare erodible ground in the first 10 m of the riparian zone outside of active road areas is less than 1%. |
11.b |
Total bare erodible ground present in the first 10 m of the riparian zone, plus all other bare erodible ground hydrologically linked to the first 10 m of riparian zone is less than 5%. |
11.c |
Total area disturbed by animals or machinery in the first 10 m of the riparian zone is less than 10%. |
11.d |
Total area disturbed by animals or machinery in the first 10 m of the riparian zone, plus all other disturbed areas hydrologically linked to the first 10 m of riparian zone is less than 15%. |
The Dataset
The 277 sites are located on Rocky Mountain region according to the map below (Figure 11) - 'Not properly functioning' (red); 'Properly functioning at high risk' (orange); Properly functioning at risk (yellow); 'Properly functioning' (green).
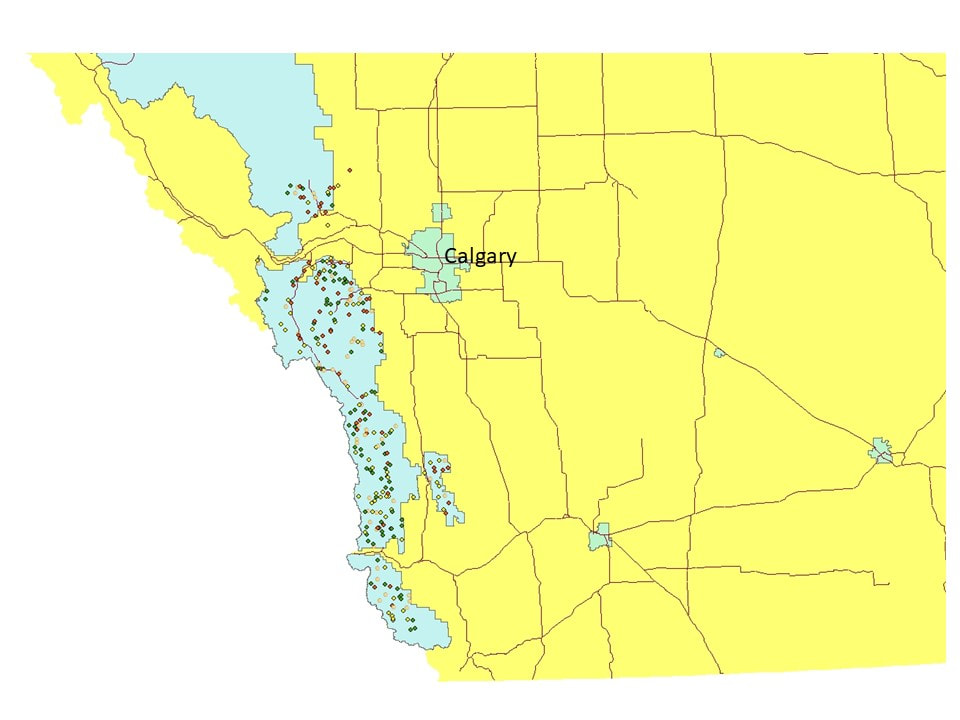
Figure 11: The 277 sites are on southern Alberta, mostly in Rocky Mountains area. 'Not properly functioning' (red); 'Properly functioning at high risk' (orange); Properly functioning at risk (yellow); 'Properly functioning' (green)
The variables used for the analysis
The answers for the 15 main questions were used for the first CART analysis with multivariate partitioning tool (mvpart from R).
All variables were related to the result that classified each site in:
- Not properly functioning;
- Properly functioning at HIGH risk;
- Properly functioning at RISK;
- Properly functioning.
The causes of damages for each main question and the percentage of bank coverage by deep-rooted plants were used in the correlation with the results.
R analysis
The R statistical software was used for this analysis.
RandomForest was the tool used to fill a small portion of voids in the dataset.
RandomForest was the tool used to fill a small portion of voids in the dataset.
A CART was performed to analyze the relationship among the 15 questions and the 4 classes of functionality.
An analysis correlating causes of damages and the riparian condition was performed including the presence of deep-rooted plants on the bank.
The classes were converted in numbers for this analysis: 'not properly functioning' (1), 'properly functioning at high risk'(2), 'properly functioning at risk'(3) and ' properly functioning'(4). Then, a multivariate partitioning was performed including the 15 questions, converting 'Yes' into '1', 'No' into '0' and 'NA' into 'blank'.
Additional questions explaining the causes for the damage in each main question were counted and classified in 'Natural' and Anthropic'.
'Natural' represents the damage in the riparian area caused by floods, natural tree fall, sedimentation from upstream and any other natural cause.
'Anthropic' represents the damage in the riparian area caused by grazing, logging, recreation or any other human-related activity.
The script is as follows:
